
Bias Variance trade-off
- Aryan

- Feb 4, 2025
- 4 min read
Updated: May 26, 2025

Mostly in machine learning we have sample data and we make predictions on that sample data . Let we have a population function ;

Then we added some error in that function ;


Then we generated 1000 points (blue points) and these 1000 points are my population data.
Now we draw 3 random samples from this population data.
blue colored points represents sample 1
Orange colored triangle represents sample 2
Green colored square represents sample 3

Now let we give three peoples each dataset and we told them to fit the machine learning model to the data and they didn’t know the population line shown in diagram. Now let all students applied linear regression to the sample datasets.
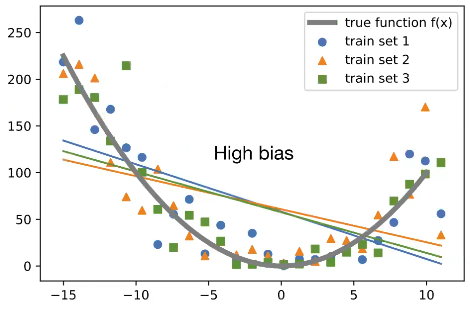
Blue colored line represents model fitted on sample dataset 1
orange colored line represents model fitted on sample dataset 2
Green colored line represents the model fitted on sample dataset 3
Bias :-> The inability of a machine learning model to fit the training data is known as bias. if a machine learning doesn’t able to fit the training data properly then it is called high bias model ,and if a machine learning model fit properly on the training dataset is know as low bias model.
Variance :-> The change in prediction of machine learning model if the training data is changed is known as variance.
All of the three linear models in diagram are high bias and low variance models.
Now we said to those three peoples that results are not good on training data. And then they applied polynomial regression .Now they have applied polynomial regression of higher degree.

Now, this is a low-bias model, but the variance has increased. The model is fitted properly to the training data, so the bias has decreased, but the variance has increased. Therefore, this is a low-bias and high-variance model.
Generally, high-variance models like the one mentioned above are prone to overfitting. Overfitting occurs when a model performs well on training data but poorly on new, unseen data. High variance is closely associated with overfitting.
Underfitting, on the other hand, is closely related to high bias, where the model fails to perform well even on the training data.
Ideally, we aim for low bias and low variance. However, achieving both is very challenging because reducing bias often increases variance, and reducing variance often increases bias.
Bias variance trade off :-> The '' trade-off " in bias variance refers to the fact that minimizing bias will usually increase variance and vice versa.
We have to find the optimal solution.
Expected value and variance :->
Expected value represents the average outcome of a random variable over a large number of trials or experiments.
In a simple sense, the expected value of a random variable is the long-term average value of repetitions of the experiment it represents . For example, the expected value of rolling a six-sided die is 3.5 because, over many rolls, we would expect to average about 3.5

Suppose we have six numbers 5,3,4,5,3,5 and we have to find the mean.


WHAT EXACTLY ARE BIAS AND VARIANCE MATHEMATICALLY ?
BIAS :-> In the context of machine learning and statistics , bias refers to the systematic error that a model introduces because it cannot capture the true relationship in the data. It represents the difference between the expected prediction of our model and the correct value which we are trying to predict. More bias leads to underfitting , where the model does not fit the training data well.

Suppose we need to solve a regression problem, and we have a sample dataset as described above. We have drawn a regression line in green, but the red line represents the true regression line of the population data. If someone uses a different dataset, they may draw a different regression line. However, the red line represents the true function or true regression line. The true function of the population data is f(x), and for each sample, we find f′(x).
Now, suppose we have 100 samples of data and calculate f′(x) for all of them. Then, we compute the expected value of f′(x), denoted as E[f′(x)]. The true value is f(x).
The bias can be mathematically expressed as:
Bias = E[f'(x)] - f(x)
Our goal is to find a machine learning model such that, when given different sample datasets, its expected value E[f′(x)] equals f(x). Such models are referred to as unbiased predictors. In these cases, f′(x)−f(x) will equal zero, and E[f′(x)] will align very closely with the red line, or f(x).
Bias (f'(x)) = E[f'(x)] - f(x) |
It is represented like this mathematically but in real world we will not have true function. The E[f'(x)] will come very close to f(x) and the difference between then is close to zero or zero and then we can say that we have unbiased predictor.
VARIANCE :-> In the context of machine learning and statistics , variance refers to the amount by which the prediction of our model will change if we used a training data set. In other words , it measures how much the predictions for a given point vary between different realizations of the model.

Effects of Low Variance :->
Consistency Across Samples: Models with low variance are consistent across different training datasets. They tend to give similar predictions regardless of the specific data used.
Risk of Underfitting: Low variance models may oversimplify the problem, failing to capture the complexity of the data. This results in underfitting, where the model performs poorly on both training and test data.
Limited Adaptability: The model might struggle to adapt to the nuances of new data, making it less effective for complex datasets.
Effects of High Variance :->
Overfitting: High variance models are overly sensitive to the training data, capturing noise and irrelevant details instead of the underlying patterns. This results in overfitting, where the model performs well on the training data but poorly on unseen test data.
Inconsistent Predictions: Predictions may vary significantly when the model is trained on different samples of data, leading to reduced reliability.
Lack of Generalization: The model struggles to generalize to new data, which affects its real-world usability.
The ideal model achieves low bias and low variance, which ensures it learns the true underlying patterns without overfitting or underfitting the data.


