Mastering the Perceptron Trick: Step-by-Step Guide to Linear Classification
- Aryan

- Oct 18, 2025
- 6 min read
Perceptron Trick
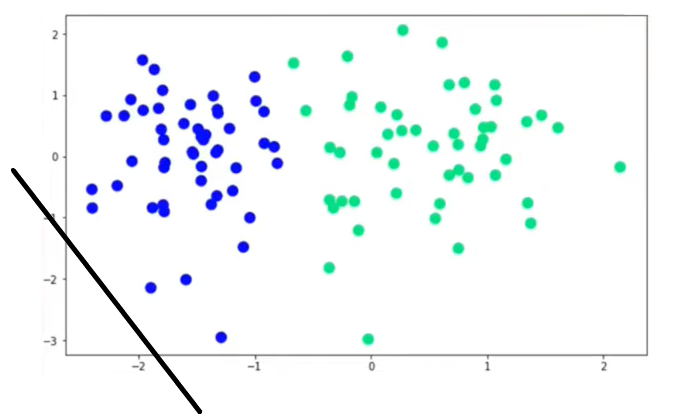
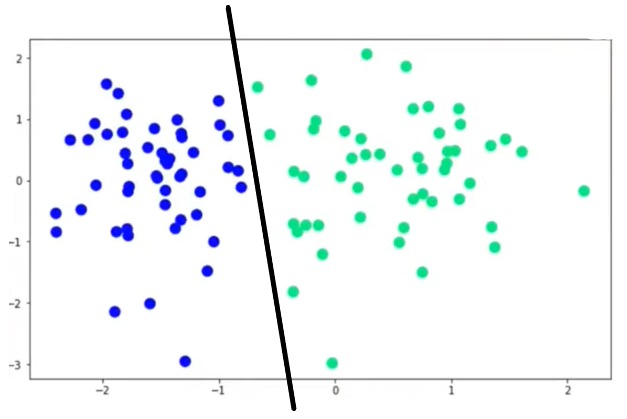
Let’s take an example where the x-axis represents a student’s CGPA and the y-axis represents their IQ.

The blue points indicate students who are not placed, and the green points represent students who got placed.
Before building any model, we first check whether the data is linearly separable—that is, whether it’s possible to separate the two classes using a straight line.
In this example, the data appears linearly separable, meaning we can draw a line that distinctly separates the placed and not placed students.
Our goal is to find such a line that divides the two classes as accurately as possible.
In a 2D space, this line can be represented as:
AX₁ + BX₂ + C = 0
In a 3D space, the equation becomes:
AX₁ + BX₂ + CX₃ + D = 0
And in higher dimensions, we can continue adding more terms.
Essentially, the perceptron’s objective is to determine the optimal values of A,B,C (and higher-order coefficients) that correctly separate both classes.
How the Perceptron Trick Works
We start by assigning random values to the coefficients.

For example, let’s initialize:
A = 1 , B = 1 , C = 0
This gives us a random line. Ideally, all green points (placed students) should lie on one side of the line (positive region), and all blue points (not placed students) on the other side (negative region).
However, since we started with random values, the line will likely misclassify several points.
To fix this, the perceptron algorithm repeatedly adjusts the line to minimize these classification errors.
Here’s how it works step by step:
We start a loop (say, for 1000 iterations or epochs).
In each iteration, we randomly pick a data point (student).
We check whether the line correctly classifies this point.
If the classification is correct, we do nothing and move to the next point.
If the classification is incorrect (for example, a blue point lies in the green region), we adjust the line.

The adjustment is made by slightly shifting the line so that the misclassified point moves to its correct side.
Then, we move to the next iteration, select another random point, check its classification, and adjust the line again if needed.
This process continues until all points are correctly classified—or until we’ve reached the maximum number of epochs.

In a Nutshell
The perceptron algorithm continuously checks whether each data point is correctly classified.
If not, it updates the position of the line by adjusting the coefficients A,B,C .
This process runs iteratively—say, 100 or 1000 times—until all points are correctly separated.
In short, we start with a random line and iteratively refine it until we find the optimal line that perfectly divides the two classes.
How to Label Regions

Now that we’ve identified our blue and green regions, let’s understand how to determine which side of the line corresponds to the positive or negative region.
Suppose our decision boundary is represented by:
2x + 3y + 5 = 0
Here, the blue region represents the positive side, and the green region represents the negative side.
If we take any point (x₁ , x₂) and substitute it into the equation:
Ax₁ + Bx₂ + C = 0
then:
If Ax₁ + Bx₂ + C > 0 , the point lies on the positive side of the line.
If Ax₁ + Bx₂ + C < 0 , the point lies on the negative side.
If it equals 0, the point lies exactly on the line.
This simple test helps the perceptron identify which region each point belongs to.
Transformations
Let’s start with an initial line equation:
2x + 3y + 5 = 0
Now, let’s understand how to move or transform a line in the perceptron algorithm.
The movement of the line is controlled by changing the values of A, B, and C in the line equation:
Ax + By + C = 0
Effect of Changing Each Coefficient
Changing C:
When we change C, the line moves parallel to itself. The slope remains constant, but the line shifts up or down (or left/right depending on orientation).

Changing A:
Changing A causes the line to rotate around an axis, tilting the line and changing its slope.

Changing B:
Similarly, changing B also rotates the line, but the effect is in a different direction, altering the line’s position differently.

Understanding Line Movement During Learning
During perceptron training, the line keeps moving as it tries to classify all points correctly.
When we say “the line is adjusting itself”, it means the coefficients (A, B, C) are being updated.
Each time some points are misclassified, the model updates these coefficients so that the line shifts or rotates to minimize misclassification.
Example: Correcting Misclassified Points

Suppose we have four points — two green (positive class) and two blue (negative class).
Initially, the line incorrectly classifies two of them.
The green region is above the line (positive side).
The blue region is below the line (negative side).
However:
One green point lies on the negative side (wrongly classified).
One blue point lies on the positive side (also misclassified).
Case 1: Misclassified Blue Point
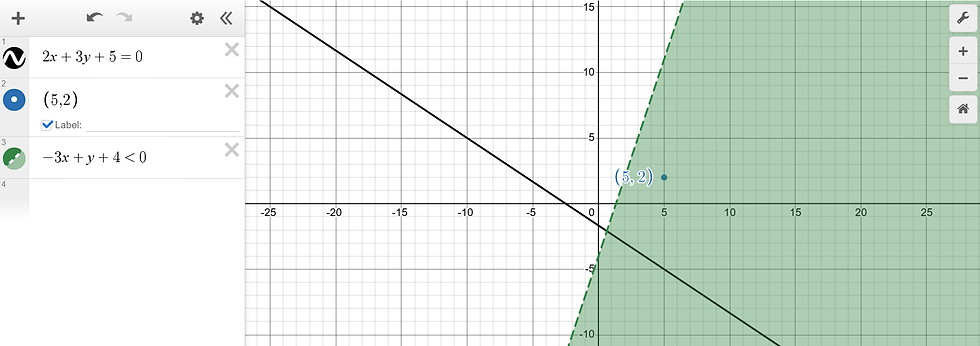
Suppose the blue point on the positive side has coordinates (5, 2).
We represent it as (5, 2, 1) (adding bias term).
We subtract the line’s coefficients from the point coordinates:
−3x + y + 4 = 0
This changes the position of the line such that it now moves toward the negative region, correctly classifying the blue point.

Case 2: Misclassified Green Point
Now consider a green point at (-3, -2) that lies on the negative side.
We again represent it as (-3, -2, 1).
Here, we add the line’s coefficients to move the line toward the positive region.
The new equation becomes:
−x + y + 6 = 0
After this transformation, the green point now lies correctly in the positive region.

Transformation in Practice
In actual machine learning implementation, we don’t perform such large transformations in one step.
Instead, we use a small constant called the learning rate (η).
When we add or subtract coefficients, we multiply them by the learning rate before updating:
New Coefficients = Old Coefficients ± η × (Point Features)
This ensures that the line moves gradually and smoothly, adjusting itself step by step until all points are classified correctly.
Perceptron Algorithm
Let’s understand how the perceptron algorithm works step by step.
Suppose we have the following data:
CGPA | IQ | Placed |
7.5 | 81 | 1 |
8.9 | 109 | 1 |
7.0 | 81 | 0 |
We can represent the decision boundary (line) as:
W₀ + W₁x₁ + W₂x₂ = 0
Here,
W₀ = bias term (c),
W₁ = coefficient for x₁ (A),
W₂ = coefficient for x₂ (B).
To include bias in the model, we introduce an additional feature x₀ = 1 for all data points.
Now the equation becomes:
W₀x₀ + W₁x₁ + W₂x₂ = 0
Or more generally:
Σ (Wᵢ × Xᵢ) = 0, for i = 0 to n
This is our perceptron model. Here, we have three coefficients (W₀, W₁, W₂), whose values are updated using the perceptron learning rule.
Prediction Workflow
Suppose we want to predict for the first student:
x₀ = 1, x₁ = 7.5, x₂ = 81
Then the equation becomes:
W₀×1 + W₁×7.5 + W₂×81
We compute this value by taking the dot product of weights and features.
If the final result is greater than or equal to 0, the student is placed (1).
If it is less than 0, the student is not placed (0).
That’s how the perceptron makes predictions.
Training Algorithm
Let’s now see how the perceptron updates its coefficients.
Choose a number of epochs (say 1000).
Set a learning rate η (usually 0.01).
For each epoch, pick one training example (a student record).
Check whether the point is correctly classified.
If it lies in the negative region but the computed value is ≥ 0 (model says placed, but actually not placed), update:
Wₙₑw = Wₒld − η × Xᵢ
If it lies in the positive region but the computed value is < 0 (model says not placed, but actually placed), update:
Wₙₑw = Wₒld + η × Xᵢ
If classification is correct, no change is made.
Formally:
If xᵢ ∈ N and Σ(Wᵢ × Xᵢ) ≥ 0, then
Wₙₑw = Wₒld − η × Xᵢ
If xᵢ ∈ P and Σ(Wᵢ × Xᵢ) < 0, then
Wₙₑw = Wₒld + η × Xᵢ
Simplified Update Rule
The perceptron’s update step can also be written in a single general form:
Wₙₑw = Wₒld + η × (Yᵢ − Ŷᵢ) × Xᵢ
bₙₑw = bₒld + η × (Yᵢ − Ŷᵢ)
Yᵢ | Ŷᵢ | (Yᵢ − Ŷᵢ) |
1 | 1 | 0 |
0 | 0 | 0 |
1 | 0 | 1 |
0 | 1 | -1 |
We apply this rule for every data point in each epoch.
If the model correctly classifies a point, the difference (Yᵢ − Ŷᵢ) becomes zero, so no change occurs in the weights.
If the model misclassifies, the term (Yᵢ − Ŷᵢ) becomes positive or negative, automatically adjusting the weights in the correct direction.
Over multiple iterations, this process finds the best line that correctly separates all points — achieving accurate classification through gradual, data-driven updates.


